
新しい施策を実施検討するうえで、ゴールとの関連が強いページ、弱いページを把握することで配信面も加味してより効果的な施策を生み出すことが可能です。
アクセス方法
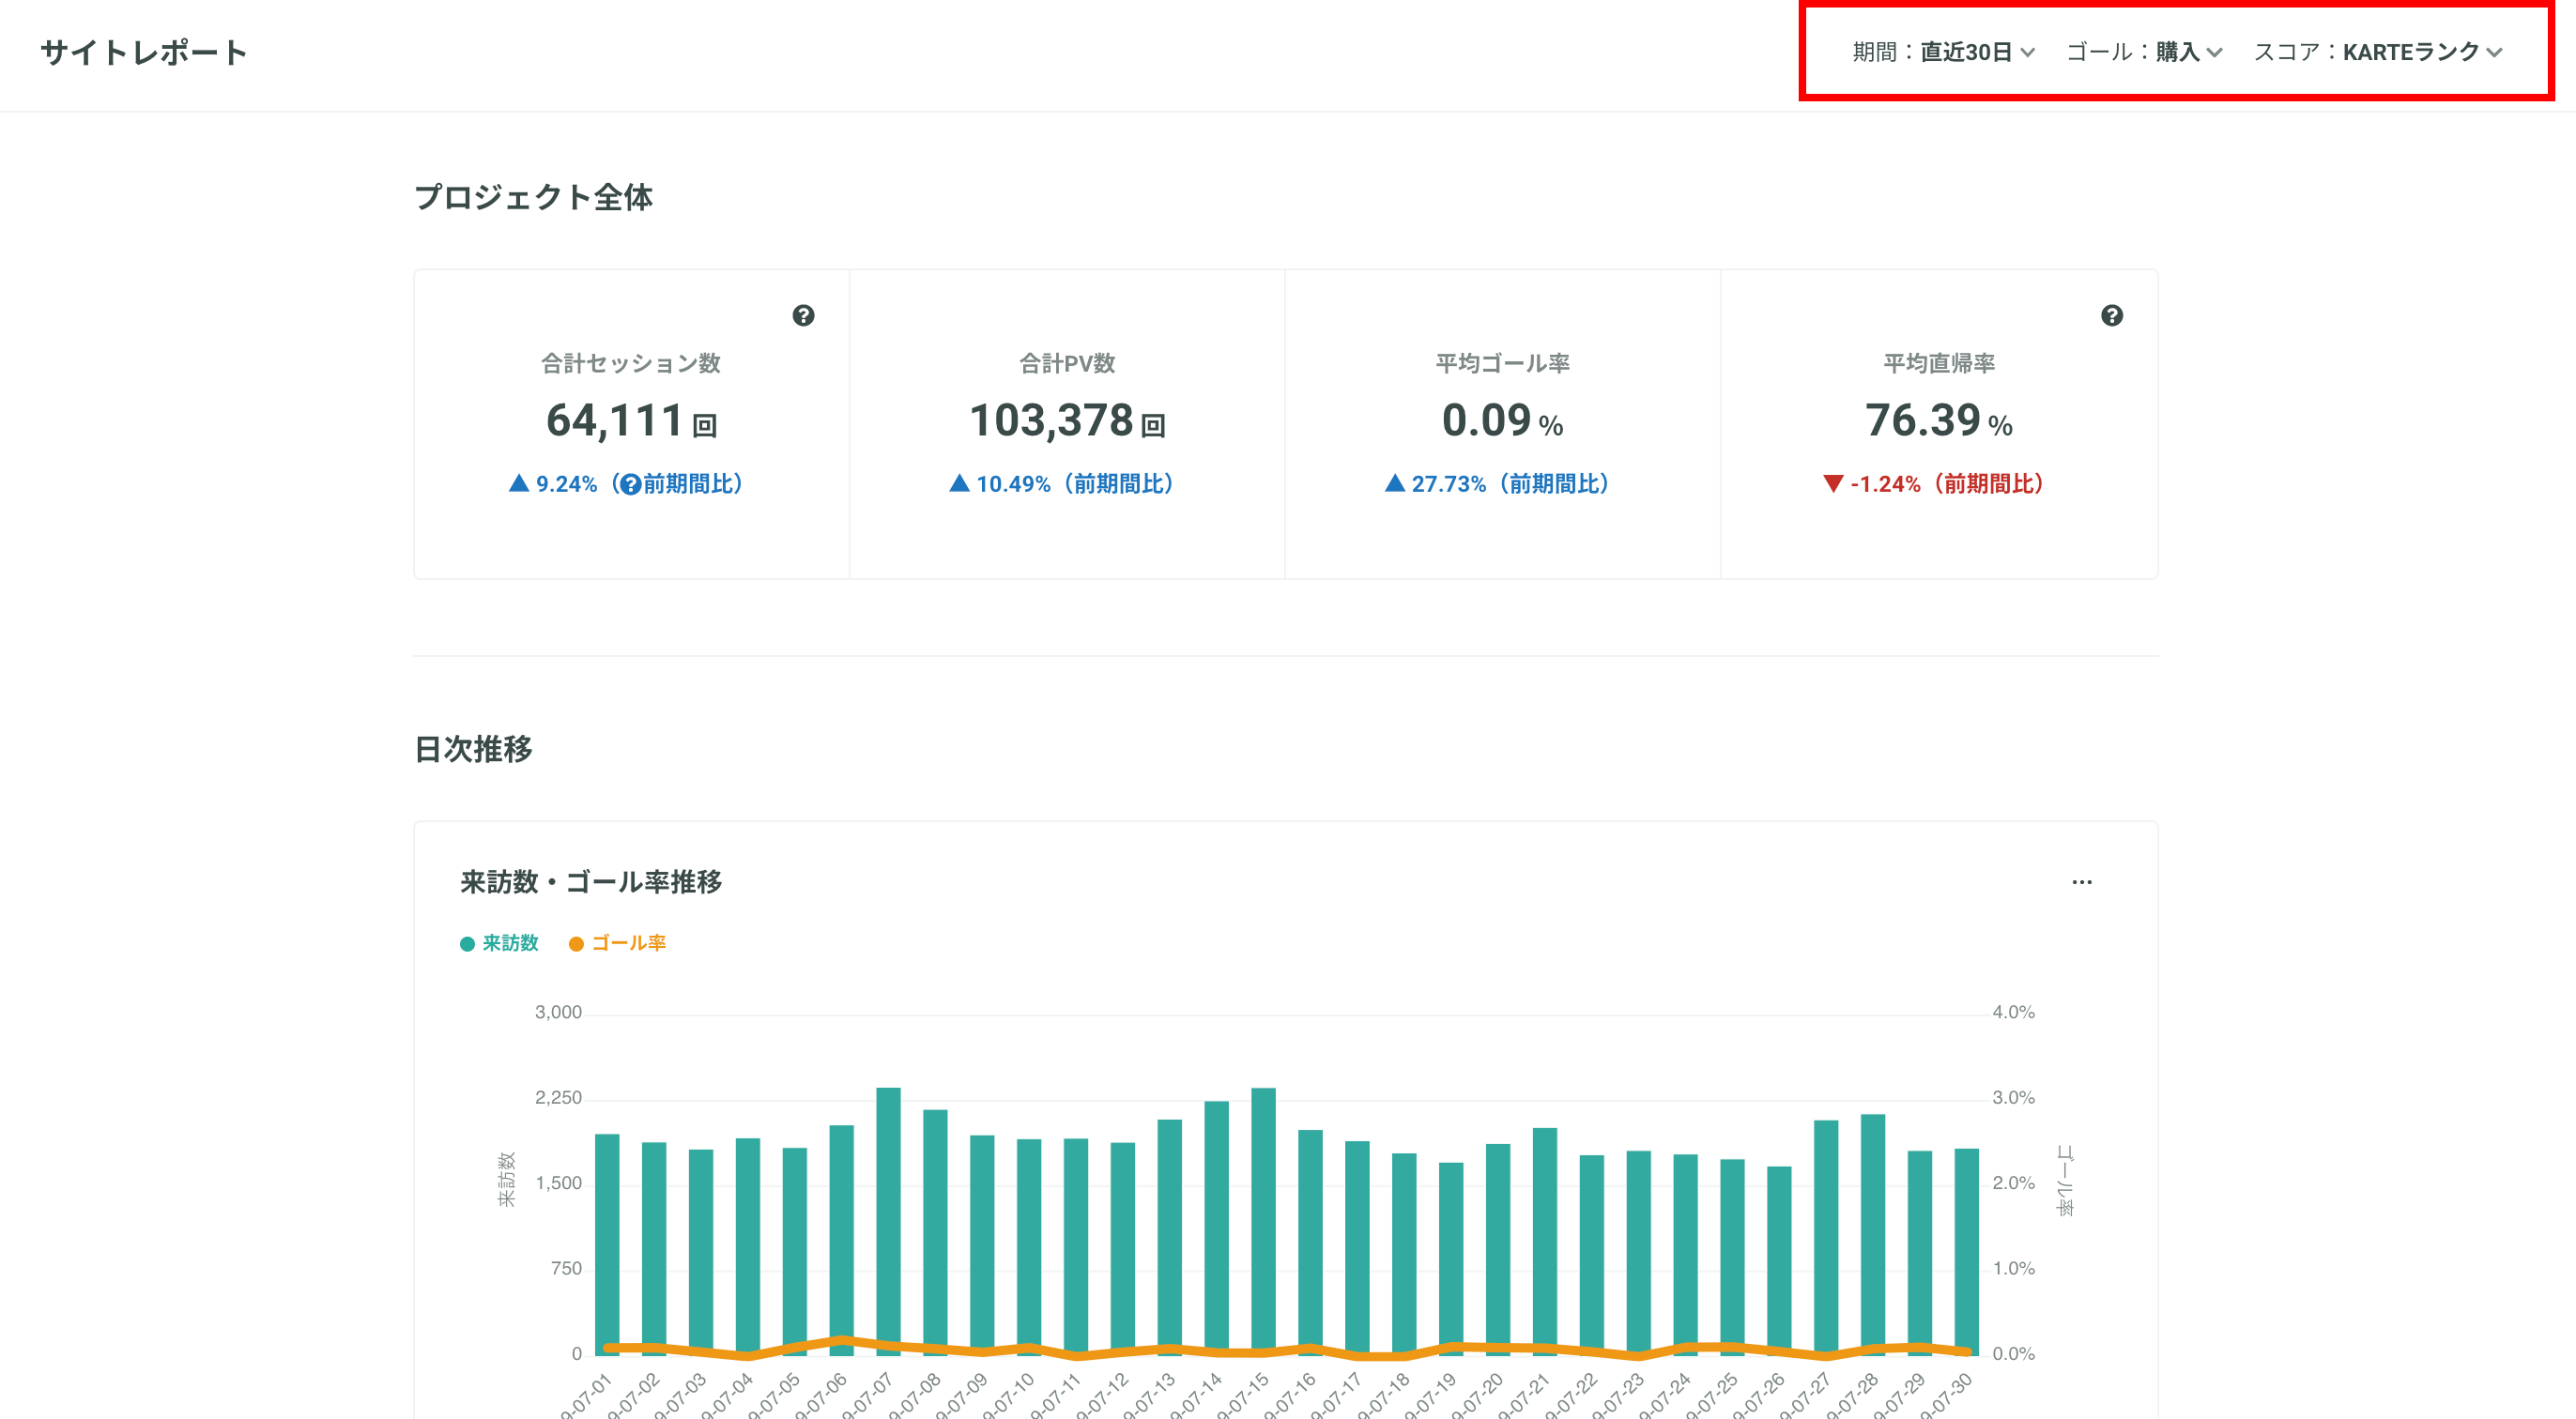
レポート > サイトの分析 > サイトレポート > ページ毎詳細チャート を使用します
利用方法
まずヘッダーの表示期間を選択します。その際、見たいゴールイベントを合わせて選択してください。
再読み込み後、ページ毎詳細の「ゴール率」を確認します。
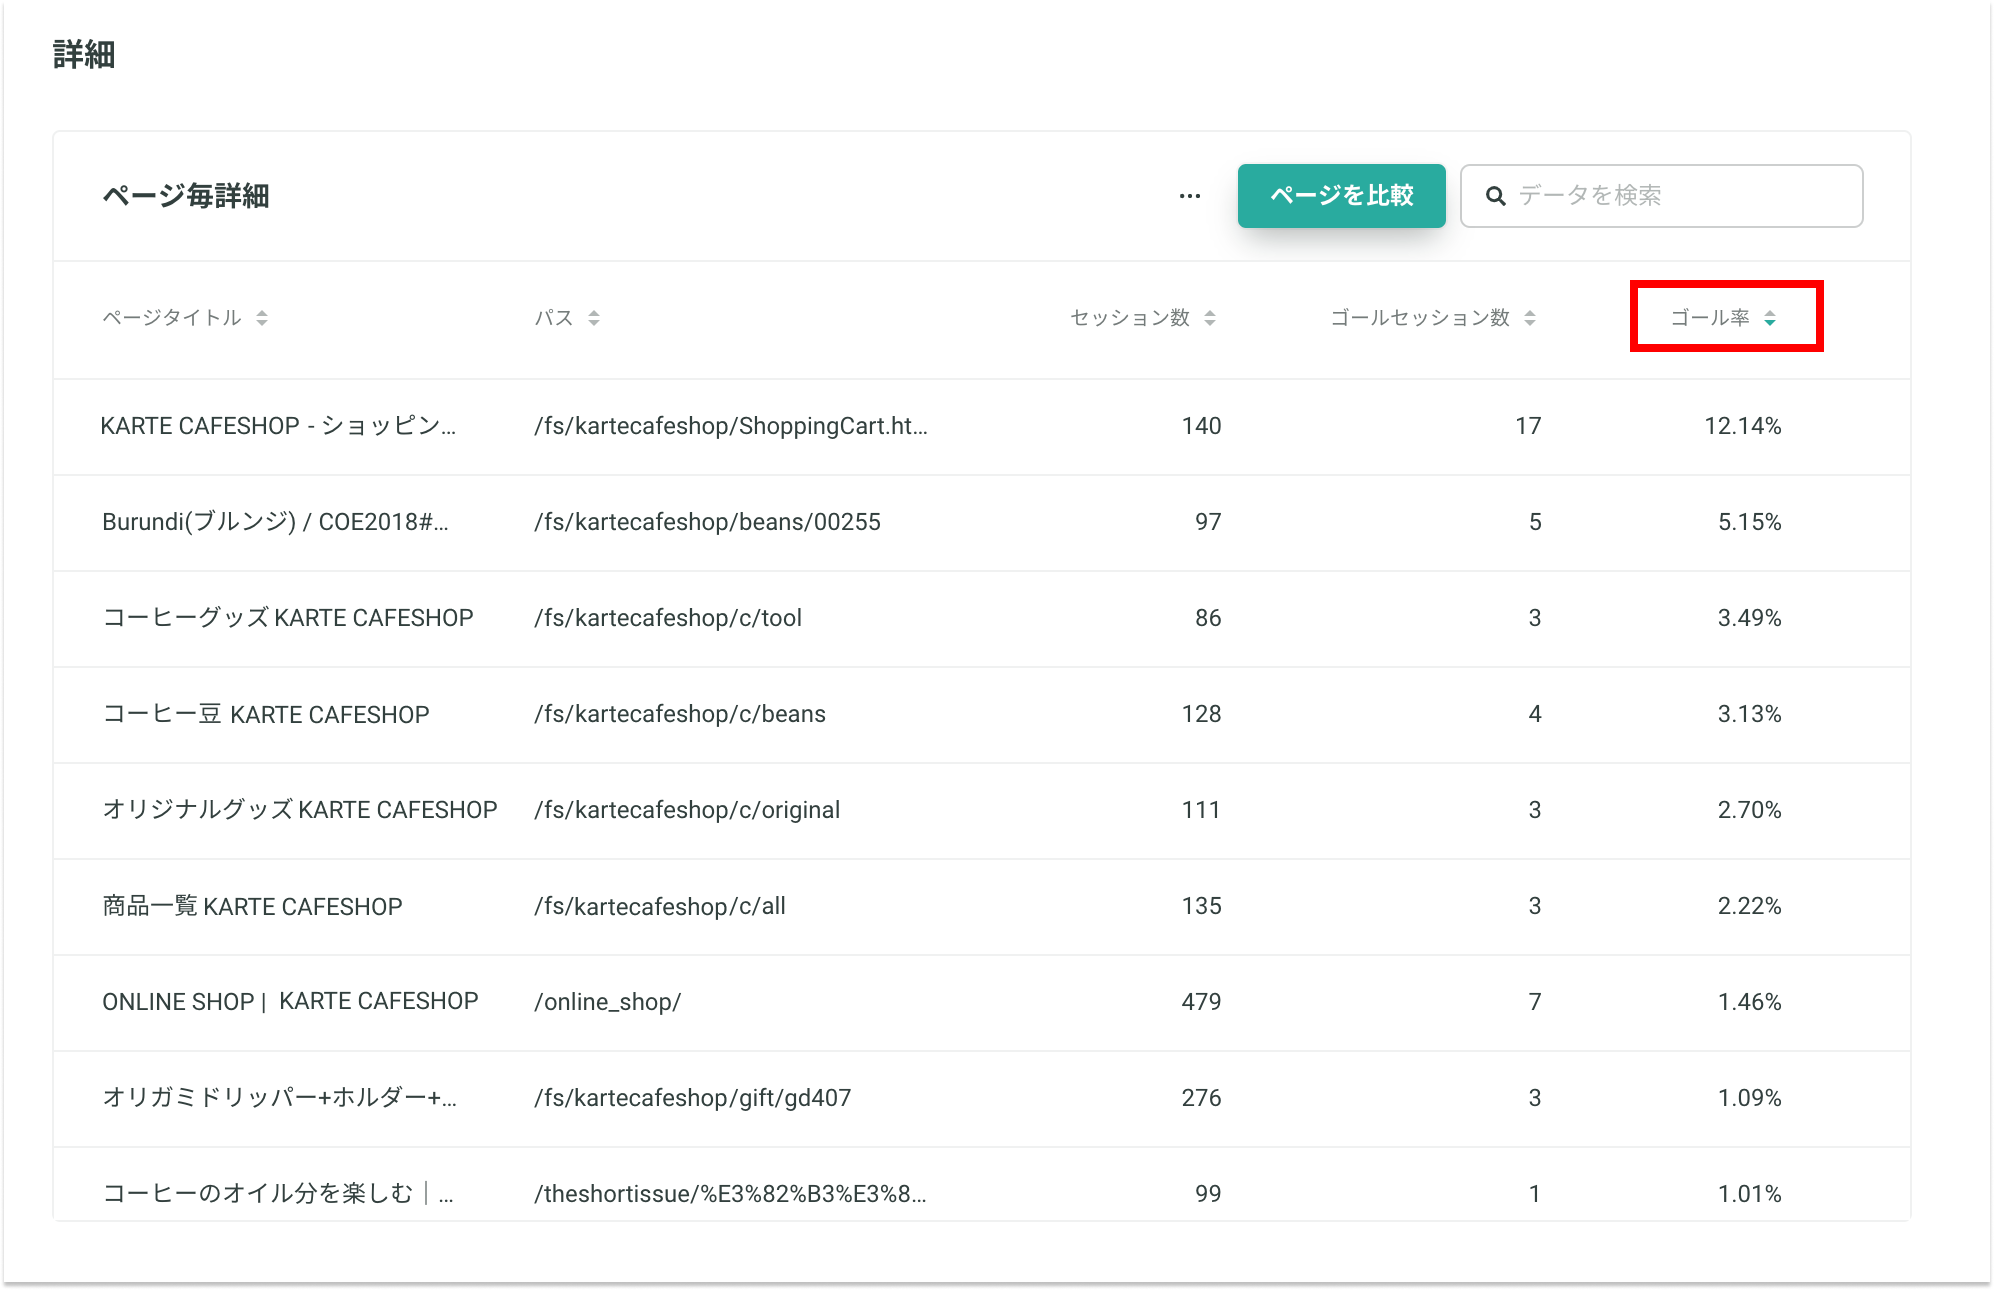
ページ毎詳細のテーブルチャートから見たい指標部分の▼▲アイコンをクリックして昇順(▲)・降順(▼)を選択します。

利用シーン例

ゴール率
上記ではゴール率が高い順にページをソートしました。
・Burundi(ブルンジ) / COE2018#
・コーヒーグッズ KARTE CAFESHOP
特に上記の2ページがゴール率が相対的に高いことがわかります。このページを閲覧しているとゴールする可能性が高いため、販促目的の接客を配信して更に効果を高めることもできるかもしれません。
ちなみに、今回の例では「購入」をゴールとした時のゴール率が最も高いページはカートページでした。購入ステップ上確実に通過するページでは発見要素が特にないため分析からは省いています。
逆にゴール率が想定より低いページを抽出して、接客を用いてパフォーマンスを改善することも考えられます。