
概要
ユーザー構成比では、可視化した推移や表テーブルのデータをダウンロードできます。
集計データを自分好みに再集計・可視化できますので、報告用の資料作成や他のデータと組み合わせた分析にご活用ください。
推移データのCSVダウンロード
以下の手順でCSVダウンロードが可能です。
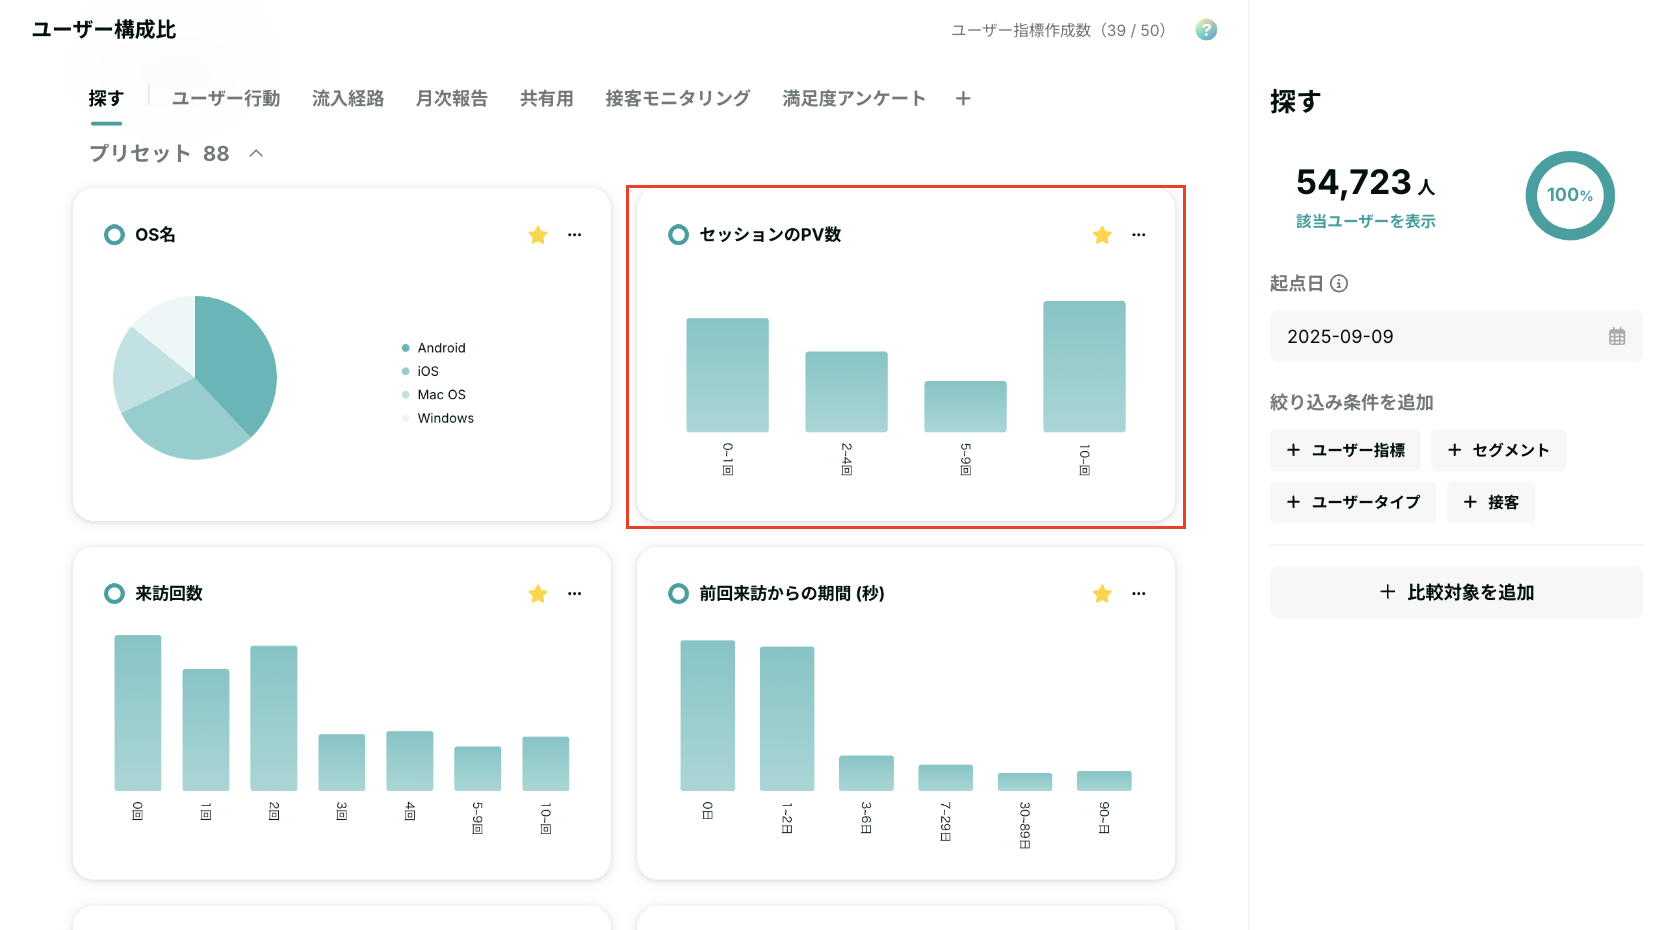
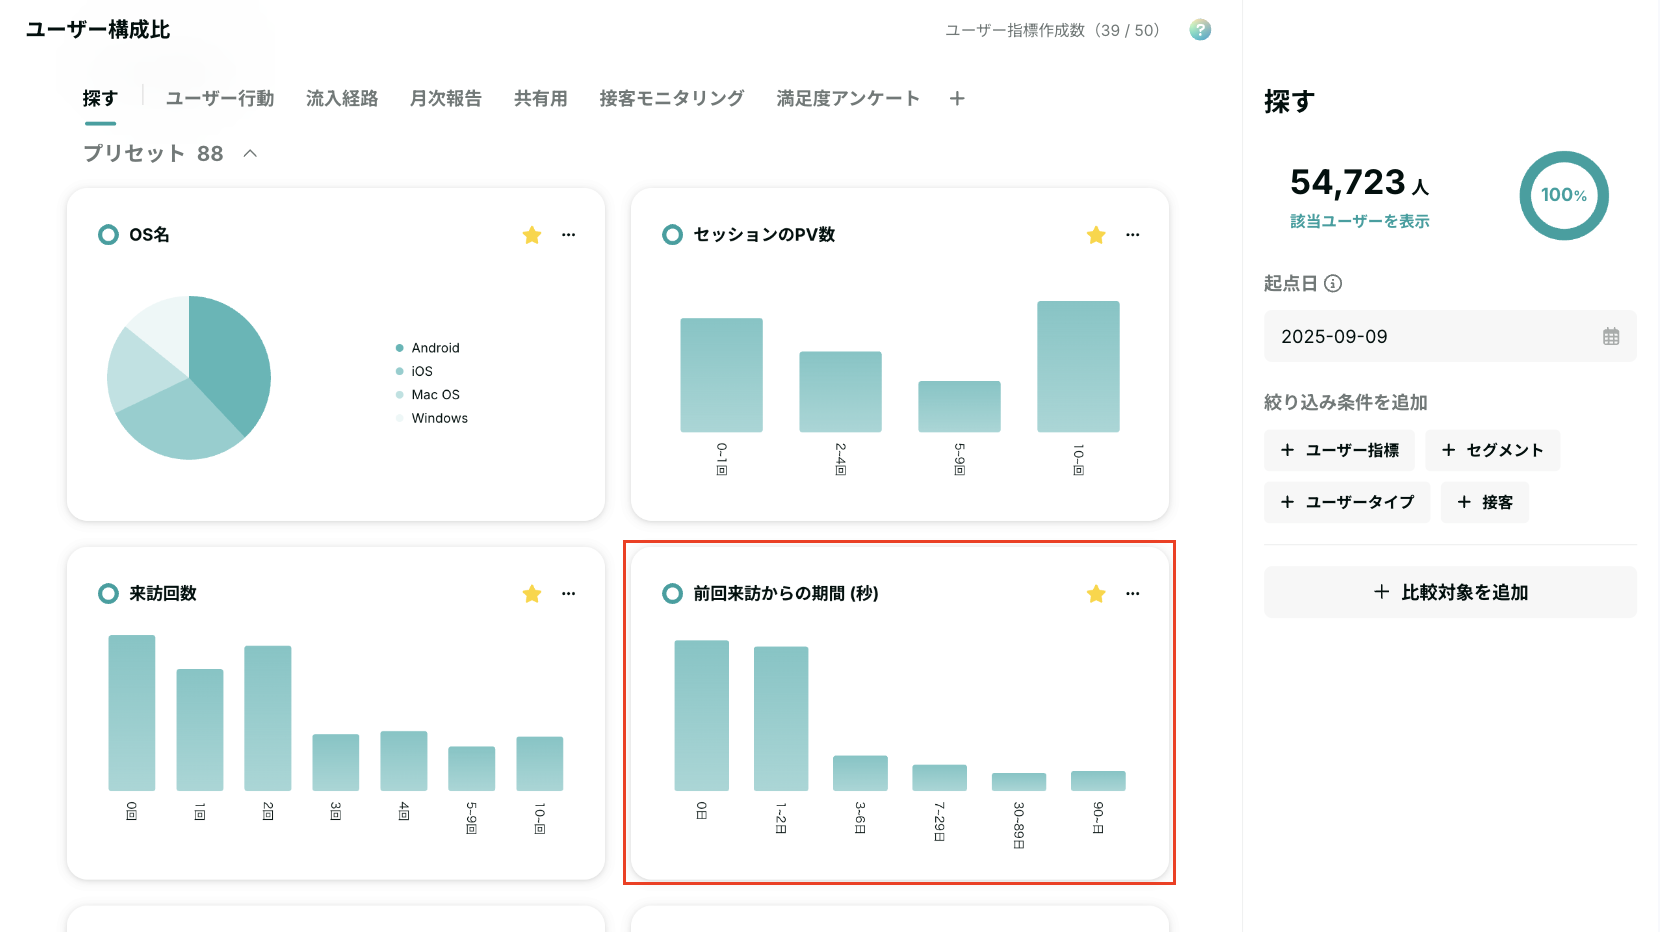
ダウンロードしたい指標のチャートをクリック
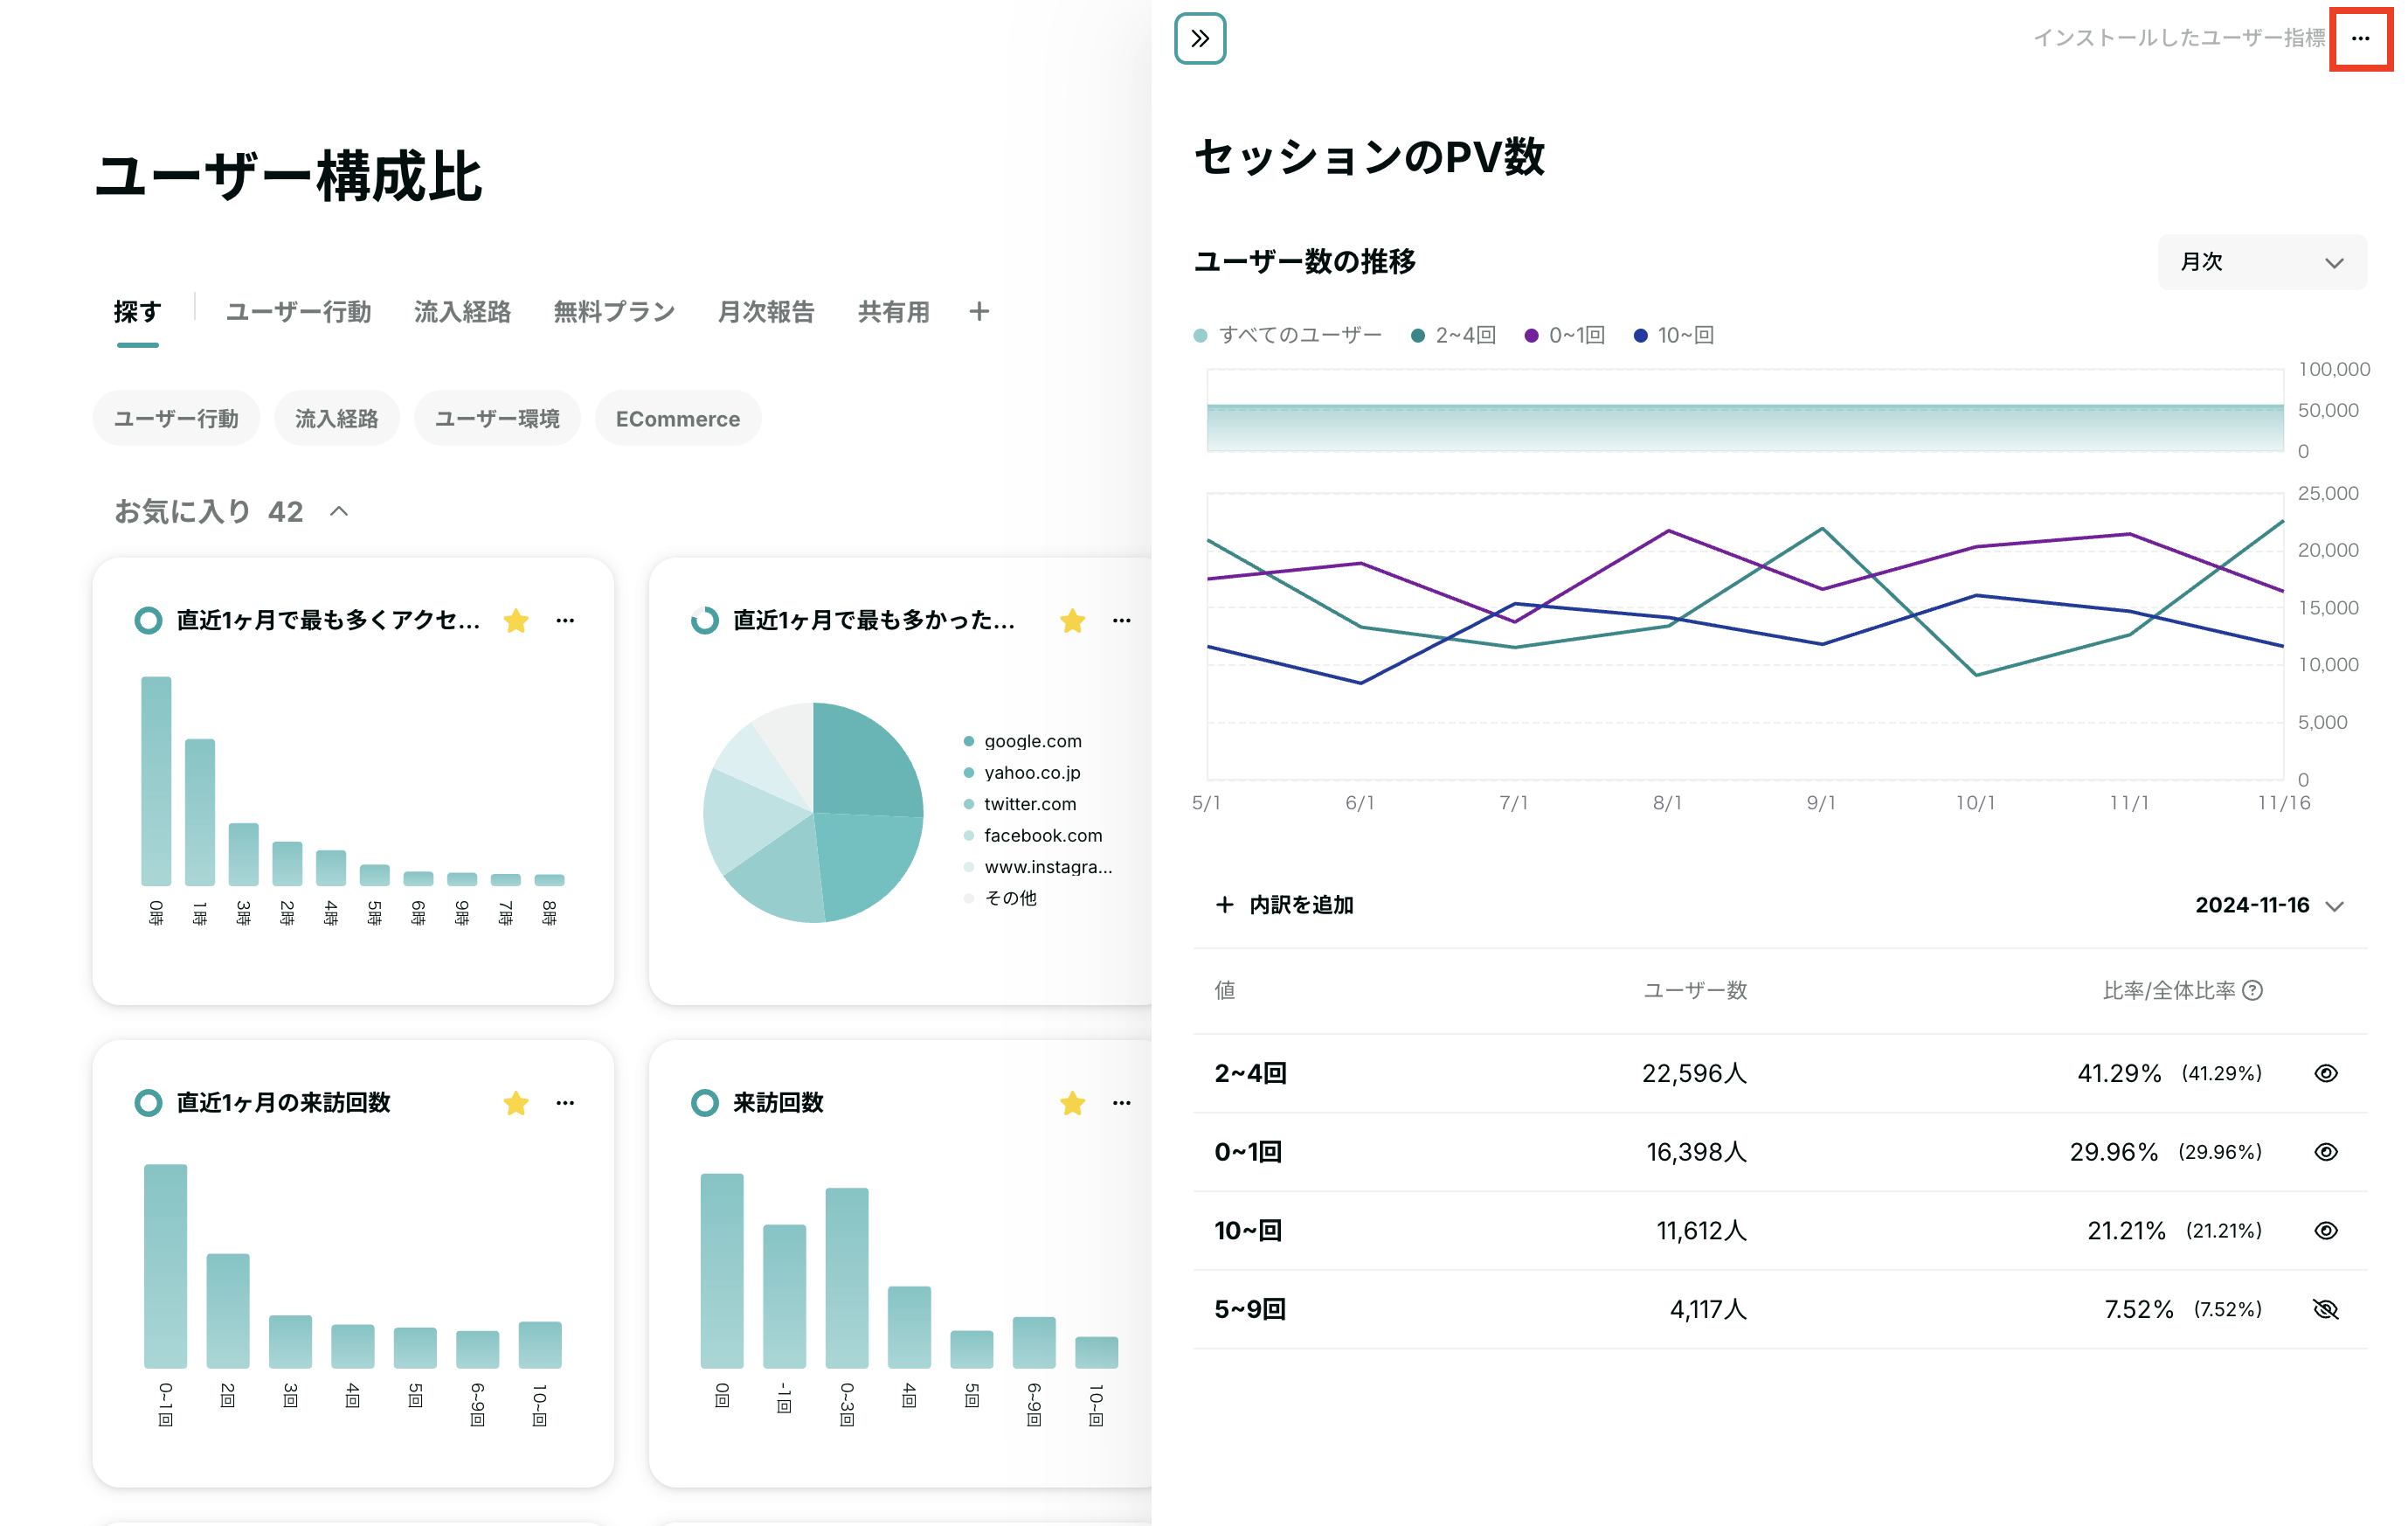
右上の3点リーダーをクリック
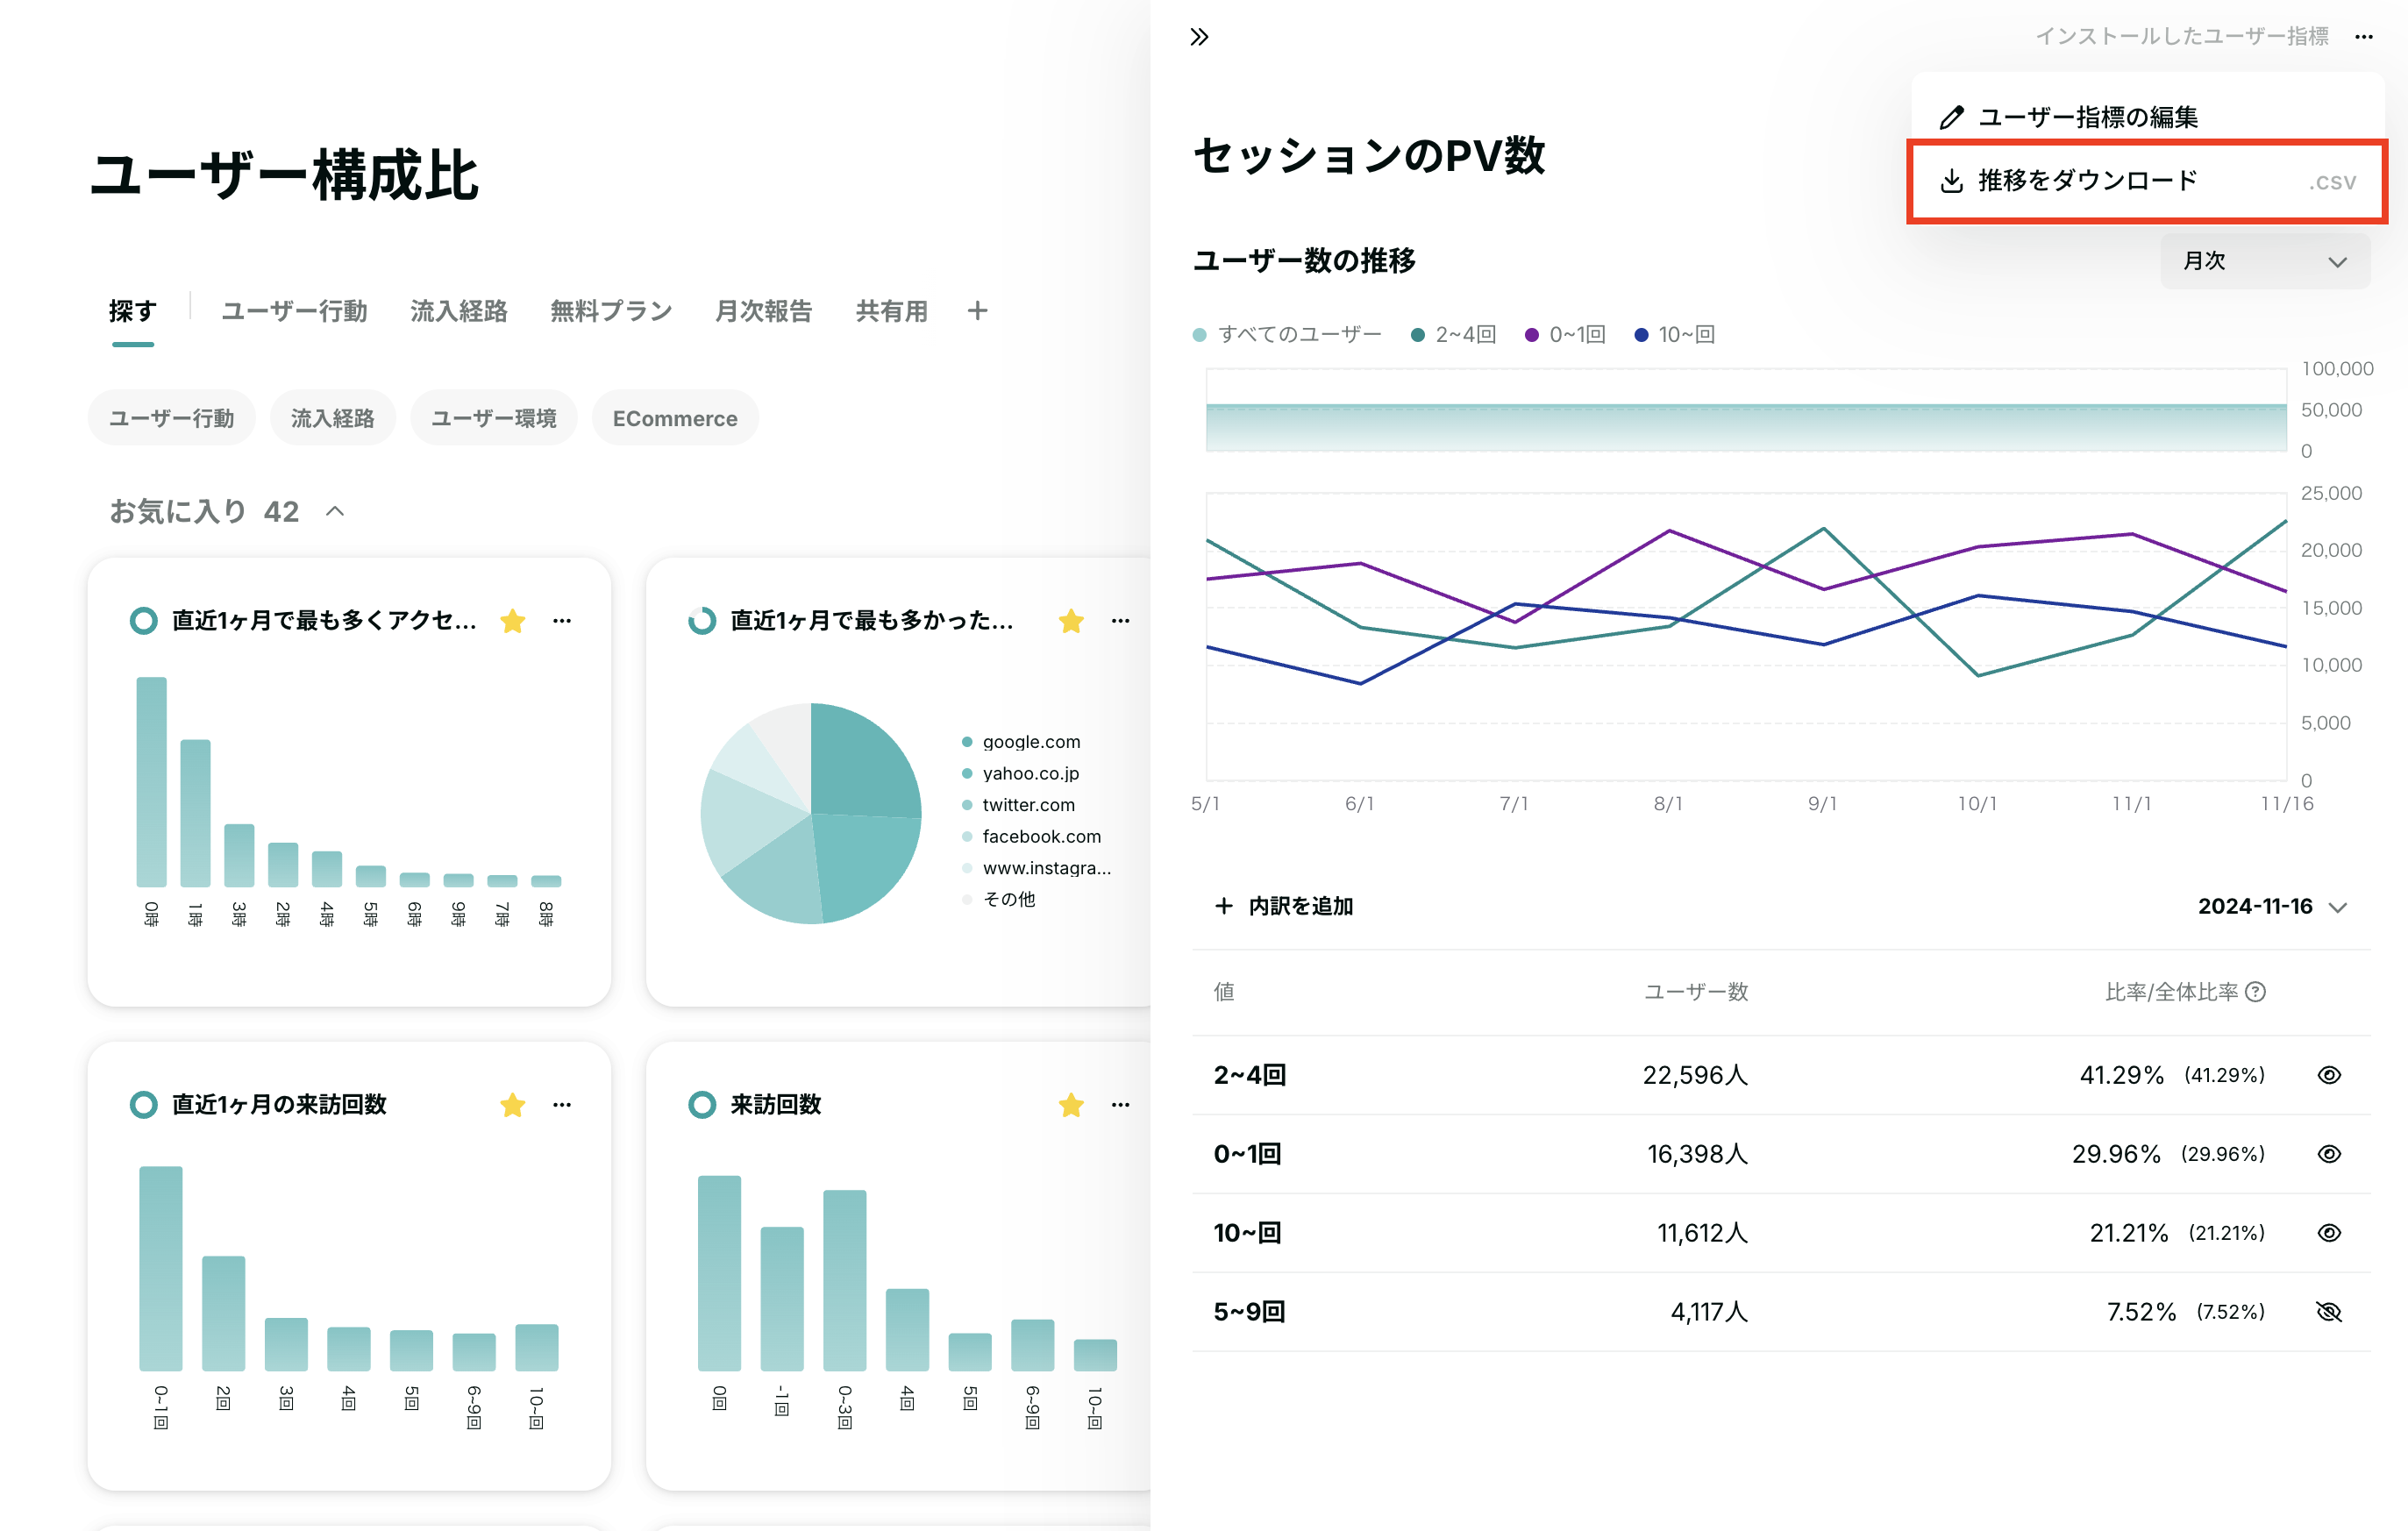
推移をダウンロードをクリック
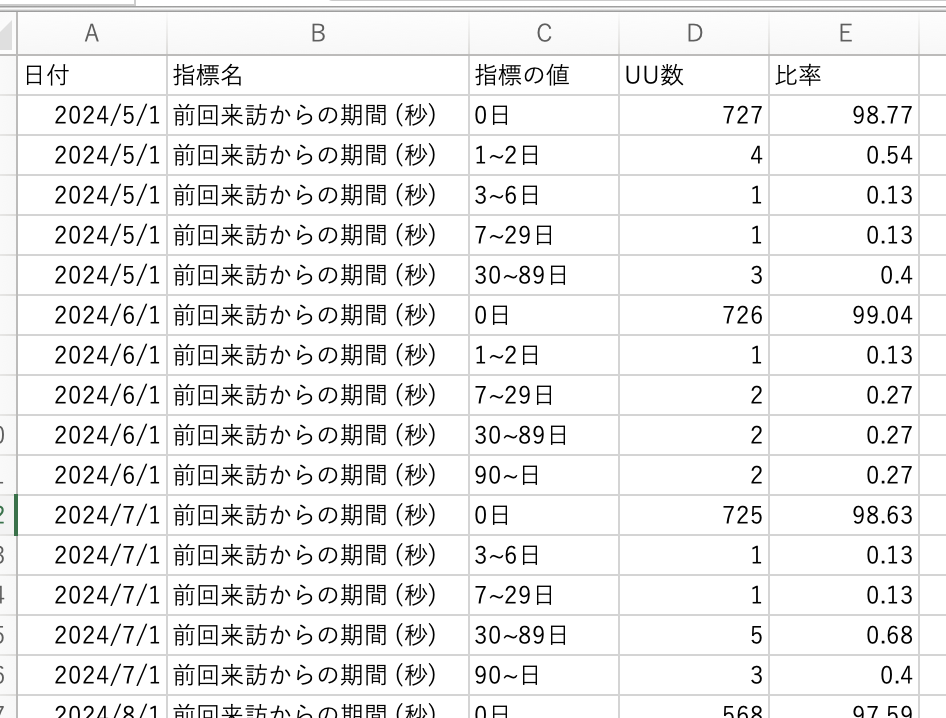
以下のようなCSVをダウンロードできます


表テーブルデータをクリップボードにコピー
以下の手順で表テーブルをコピーすることが可能です。
Excelやスプレッドシートなどにペーストしてお使いください。
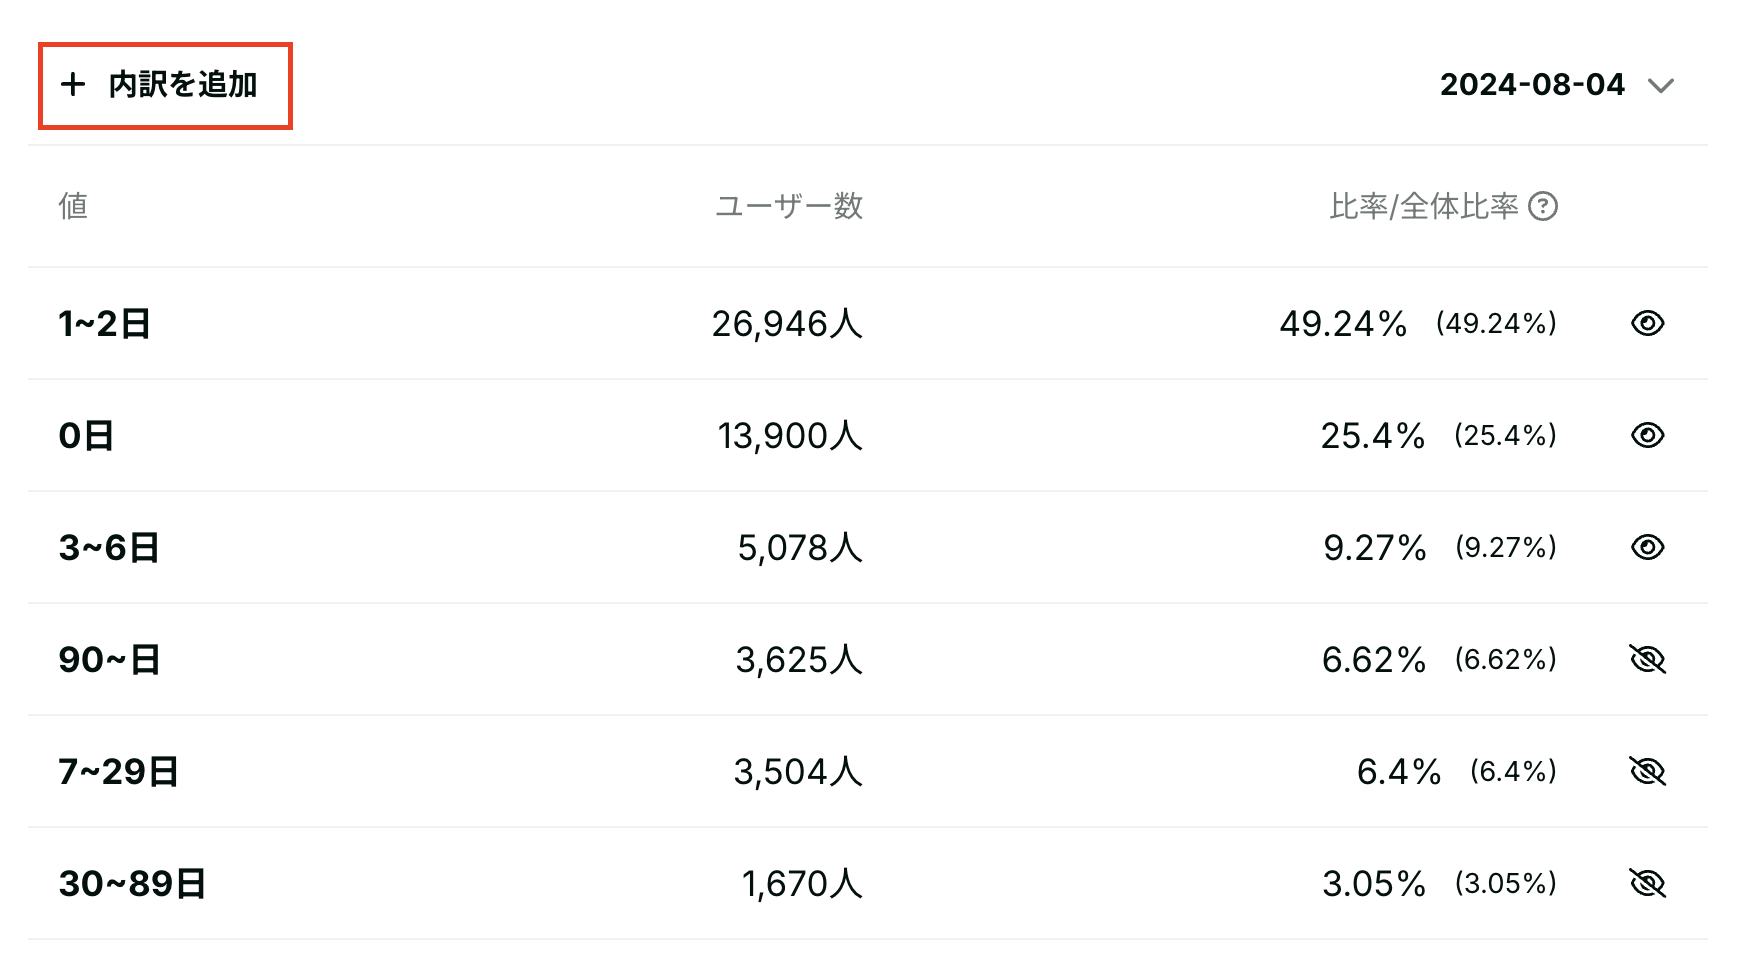
ダウンロードしたい指標のチャートをクリック
「内訳を追加」をクリック
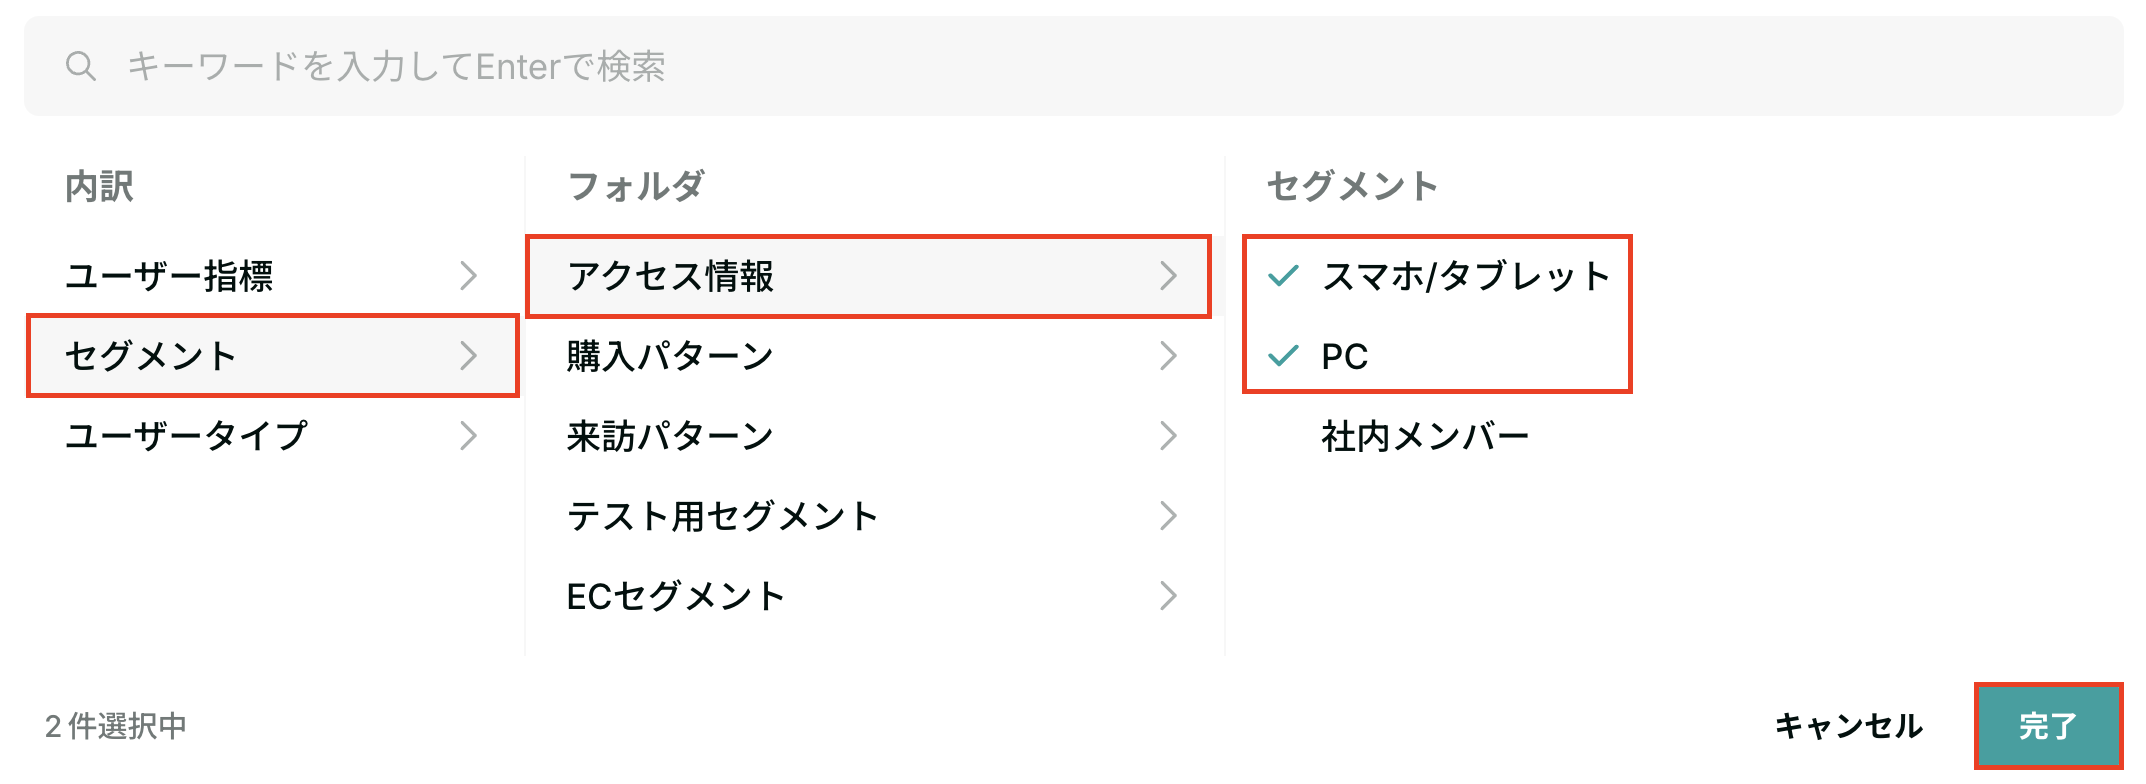
追加したい内訳を選択して「完了」をクリック
「表をコピー」をクリック
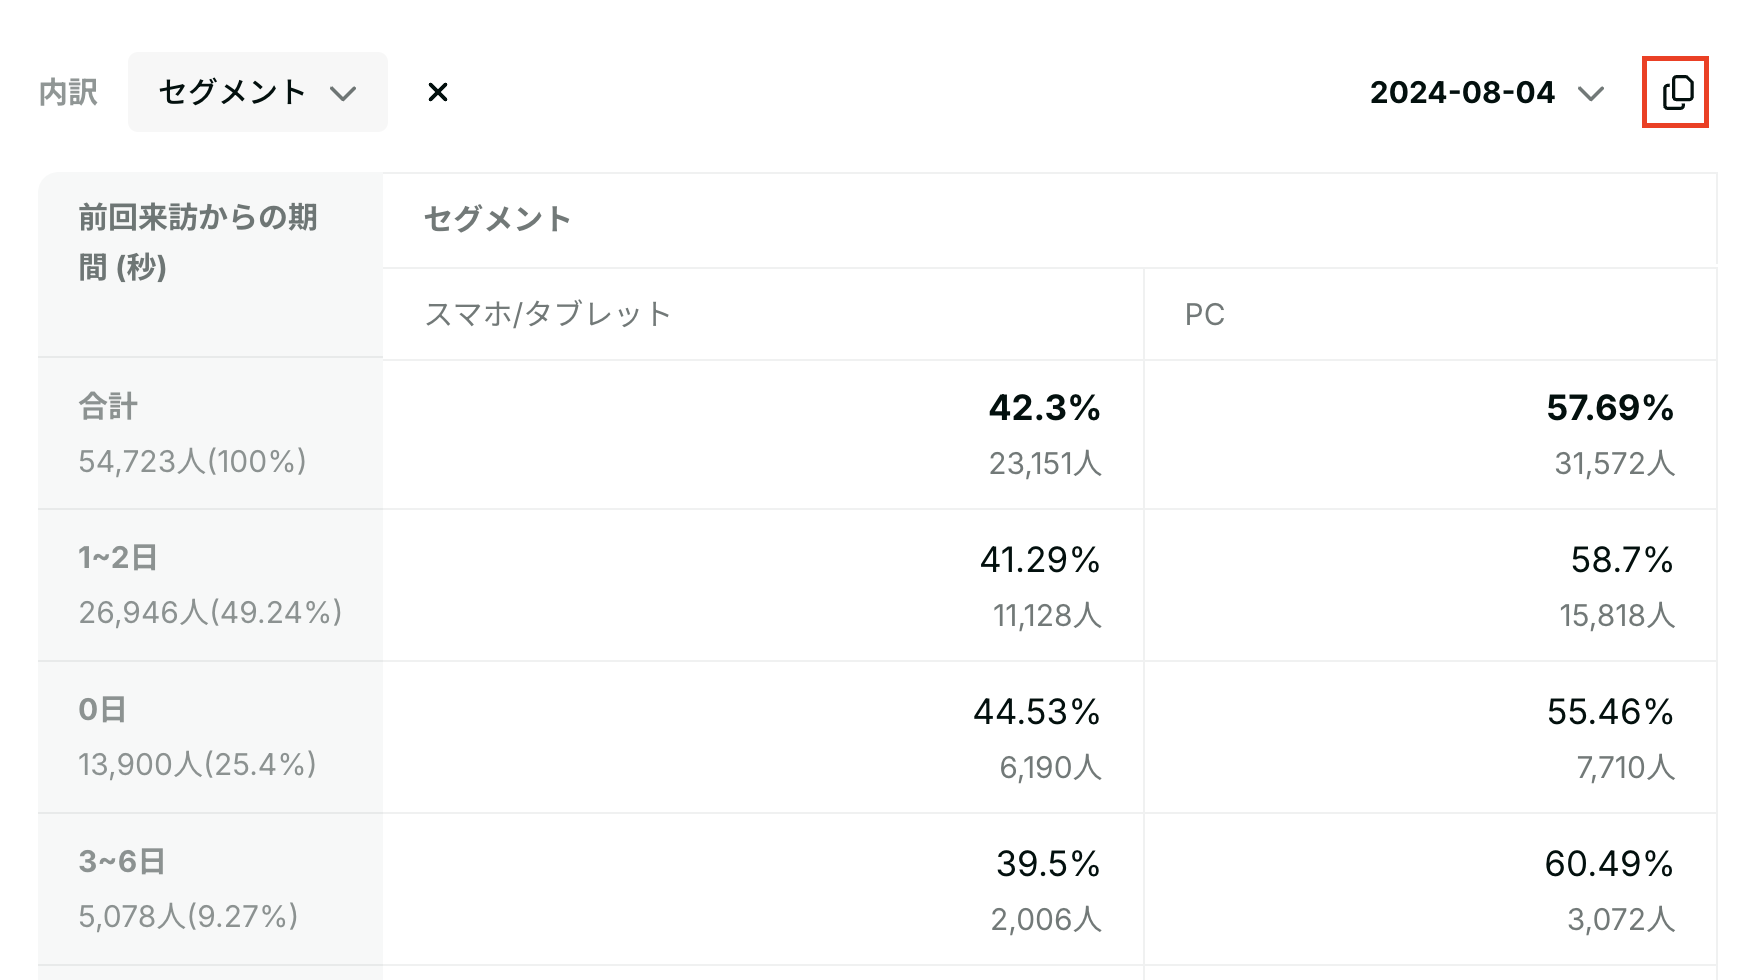
Excelやスプレッドシートなどにペーストする
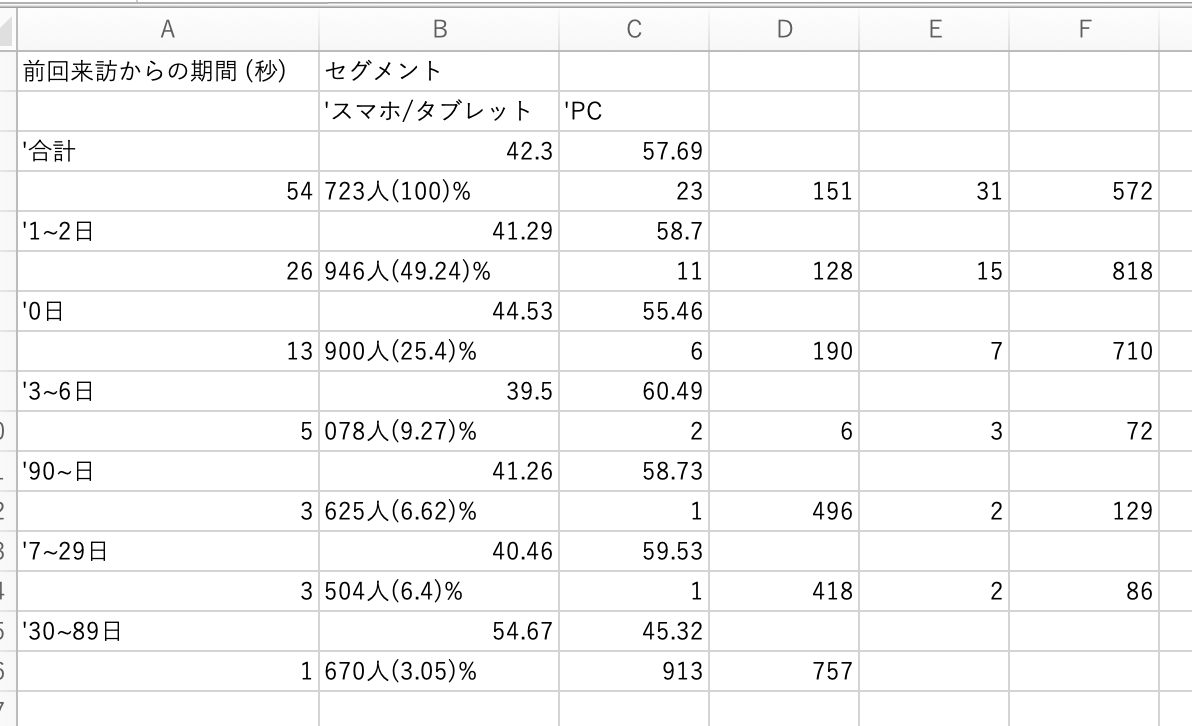


ユースケース例
以下のようなシーンでご利用いただけます。
- 報告用のフォーマットに沿って集計し直したい
- 例:毎月提出している報告資料に合う形にデータを整形する
- 他のデータと組み合わせて分析をしたい
- 例1:直近1ヶ月の来訪回数の推移を自社広告キャンペーンのカレンダーと突き合わせて分析する
- 例2:他の分析ツールと並べて比較する際に集計の仕方を揃える